TECHNOLOGY
Optimizing F1 with Real-Time Charts
The world of Formula 1 racing is one of high-speed innovation, where success is often determined by a team’s ability to adapt and react in real-time. As technology continues to advance, data plays an increasingly central role in these split-second decisions. Real-time visualizations, powered by cutting-edge tools such as JavaScript charts, are at the forefront of this revolution, enabling teams to extract actionable insights during races. This article explores how real-time charting solutions are transforming F1 and why they are critical for optimizing performance on the track.
The Importance of Real-Time Data in F1
Modern Formula 1 cars are more than machines; they are data ecosystems. Hundreds of sensors are embedded within the vehicle, capturing critical metrics such as tire temperature, engine performance, fuel efficiency, and aerodynamics. Every lap generates gigabytes of data that must be processed, interpreted, and acted upon instantaneously.
A developer from SciChart, a leader in advanced charting solutions, shared their insights on the topic, emphasizing that “in high-stakes scenarios like F1, the ability to process and visualize data in real time is more than a competitive edge—it’s a necessity. Charting tools must be responsive, robust, and adaptable to diverse data streams. Teams rely on these visualizations to make decisions that could mean the difference between victory and defeat.”
Real-time data visualization allows race engineers to monitor the car’s condition while it speeds around the track. A temperature spike in the brakes or a dip in engine power can be detected through a graphical interface. Without such capabilities, engineers would be blind to issues that could escalate into catastrophic failures.
This constant feedback loop of data ensures not only the car’s optimal performance but also the driver’s safety. For instance, when telemetry data shows a drop in tire grip, a well-timed pit stop can prevent a crash and preserve race strategy. This dynamic decision-making is powered by advanced tools capable of handling complex data flows, and JavaScript charts are increasingly being used for their versatility and speed.
Real-Time Charts in Race Strategy
Strategy is everything in Formula 1. Pit stops, tire choices, and fuel management must be carefully balanced to gain an edge. During a race, the margin for error is razor-thin, and even a one-second delay in decision-making can spell disaster.
Real-time charting solutions play a crucial role in devising and executing strategies. By visualizing data streams from competitors, weather conditions, and the car itself, teams can adjust tactics on the fly. For example, a sudden change in weather can make a dry track wet, requiring a switch to intermediate or wet tires. A chart displaying rainfall predictions against lap times helps teams decide when to call their driver into the pits.
Additionally, engineers use real-time visualizations to monitor rivals. Metrics such as lap times, speed traps, and sector splits are analyzed to identify vulnerabilities in competitor strategies. If a rival team pits early, for instance, charts can help determine whether to follow suit or hold out for better track conditions.
The Role of Technology in Enhancing Visualization
JavaScript charts have emerged as a leading choice for real-time data visualization due to their flexibility and cross-platform compatibility. Unlike traditional desktop-based tools, JavaScript-powered solutions are inherently web-based, allowing engineers to access data from any device with a browser. This mobility is critical in the fast-paced environment of an F1 race, where decisions often happen on the move.
Modern JavaScript charting libraries are designed to handle the high-speed, high-volume demands of F1. Features such as real-time streaming, customizable axes, and zooming capabilities enable teams to drill down into specific data points without losing sight of the bigger picture. Moreover, these tools can seamlessly integrate with other technologies, such as machine learning algorithms, to provide predictive insights.
For instance, predictive analytics can forecast when a component is likely to fail, allowing teams to replace it preemptively. JavaScript charts visualize this predictive data alongside real-time metrics, creating a holistic view that enhances decision-making.
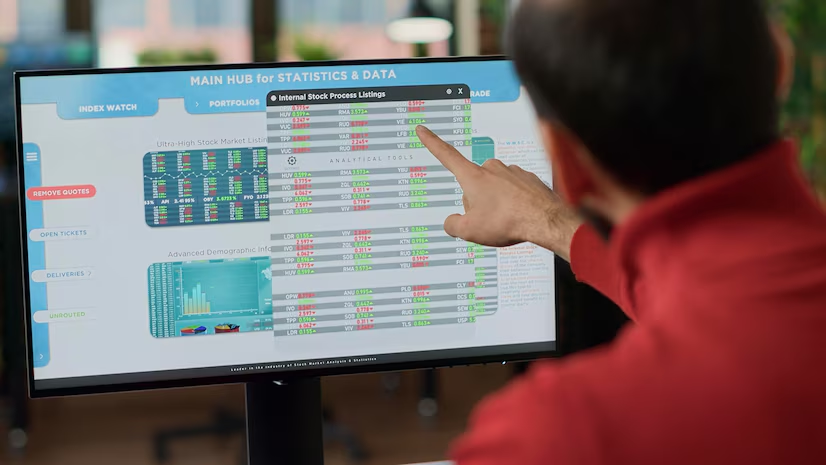
The Pit Wall: A Hub of Insights
The pit wall, often referred to as the brain of an F1 team during a race, is a hub of technological innovation. Here, engineers and strategists work in unison, surrounded by screens displaying real-time data visualizations. Every chart tells a story: tire degradation rates, fuel consumption, lap differentials, and even driver biometrics are displayed in easily interpretable formats.
These visualizations not only aid decision-making but also streamline communication. Instead of relying on verbal instructions, which can be misinterpreted under pressure, engineers point to charts to explain their rationale. For example, a sudden spike in a temperature graph can prompt an immediate radio call to the driver, instructing them to manage their braking more conservatively.
Training AI with Data
Artificial intelligence is another burgeoning area where real-time charting plays a pivotal role. Machine learning models are trained on historical and live data to identify patterns and suggest optimal strategies.
For instance, an AI model may analyze historical race data to determine the ideal lap for a pit stop. This recommendation is then visualized using a chart that overlays predicted outcomes against real-time variables, such as track conditions and competitor behavior. Engineers can evaluate these predictions in seconds and decide whether to trust the AI’s judgment.
JavaScript charts are particularly suited for such integrations, as they can dynamically update as new data is fed into the model. This adaptability ensures that teams are always working with the most accurate and relevant information.
Beyond the Race: Data in Development
While real-time data is essential during races, its importance extends far beyond the track. F1 teams use the off-season to analyze gigabytes of race data, identifying areas for improvement in car design, aerodynamics, and strategy.
Charting solutions play an integral role in this analytical process. Engineers use historical data visualizations to simulate various scenarios, testing how changes to car components or race strategies might impact performance.
For example, a chart comparing wind tunnel data against on-track performance can reveal discrepancies in aerodynamic efficiency. Similarly, simulations of fuel consumption across different circuits help optimize engine tuning for specific races.
By leveraging these insights, teams can enter the next season with a stronger, faster, and more reliable car.
The Future of F1 Visualization
As F1 continues to embrace technology, the role of real-time data visualization will only grow. Emerging trends, such as augmented reality (AR) and virtual reality (VR), offer exciting possibilities for charting. Imagine engineers using AR glasses to overlay real-time charts directly onto their field of vision, eliminating the need for physical screens.
Moreover, advancements in 5G connectivity will enhance the speed and reliability of data transmission, allowing for even faster updates to real-time charts. This will enable teams to process and act on information with unprecedented efficiency.
However, these advancements come with challenges. The sheer volume of data generated by modern F1 cars requires robust solutions capable of handling large-scale streaming without lag or loss of accuracy. JavaScript charts, with their ability to handle complex datasets and provide real-time updates, are well-positioned to meet these demands.
Conclusion
Optimizing performance in Formula 1 requires a perfect blend of human expertise and technological innovation. Real-time data visualization, powered by sophisticated tools like JavaScript charts, has become a cornerstone of modern F1 strategy. From monitoring car performance to devising race strategies and training AI models, these visualizations enable teams to make informed decisions in the heat of competition.
As the sport evolves, so too will the tools that support it. The integration of real-time charting with emerging technologies like AI and AR promises to push the boundaries of what’s possible, ensuring that Formula 1 remains at the cutting edge of innovation. For fans and teams alike, one thing is clear: the future of F1 lies not just on the track but also in the data that drives it.

Quick Answer: Magic Hour is our top AI video generator in 2026 thanks to its excellent video quality, intuitive workflow, powerful editing suite, API support, and affordable pricing. Runway, Kling AI, Pika, and Luma AI are also strong choices depending on your creative needs.
AI video generation has changed dramatically over the past year. What once required expensive software and hours of editing can now be done in minutes with a browser.
Over the past few weeks, I evaluated dozens of AI video platforms by creating marketing videos, product demos, social media clips, cinematic animations, and avatar-based content. I focused on output quality, rendering speed, ease of use, editing flexibility, pricing, and developer features.
If you’re searching for one platform that balances creativity, speed, and reliability, I guarantee at least one of these tools will meet your needs.
Best AI Video Generators at a Glance
| Tool | Best For | Text-to-Video | Image-to-Video | API | Free Plan |
| Magic Hour | Overall Winner | ✅ | ✅ | ✅ | Yes |
| Runway | Professional Editing | ✅ | ✅ | Limited | Yes |
| Kling AI | Cinematic Videos | ✅ | ✅ | No | Yes |
| Pika | Social Content | ✅ | ✅ | No | Yes |
| Luma Dream Machine | Realistic Motion | ✅ | ✅ | No | Yes |
| Synthesia | AI Avatars | Limited | No | Yes | Trial |
| HeyGen | Business Videos | Limited | No | Yes | Trial |
| InVideo AI | Marketing Videos | ✅ | Limited | No | Yes |
| Veo (Google) | High-end Generation | ✅ | Limited | Limited | Waitlist/Enterprise |
| Adobe Firefly Video | Adobe Users | ✅ | Limited | Limited | Trial |
Best Overall: Magic Hour
Best for Professionals: Runway
Best for Cinematic AI: Kling AI
Best for Marketing: InVideo AI
Best for Developers: Magic Hour API
1. Magic Hour — Best Overall AI Video Generator
Magic Hour consistently delivered the best balance of quality, speed, usability, and creative flexibility during my testing.
Unlike many AI video generators that focus on only one workflow, Magic Hour combines multiple creative tools inside one platform. That means creators don’t need separate software for image editing, face swapping, lip syncing, or animation.
One feature I particularly appreciated is the integrated image to video workflow. Instead of starting from scratch, you can transform a single image into an engaging animated sequence in just a few clicks.
For creators looking for advanced animation, the platform also offers powerful image to video ai capabilities that preserve visual consistency surprisingly well.
Another standout feature is its face swap ai technology. During testing, identity preservation was among the best I encountered, making it ideal for entertainment content, branded campaigns, and creative storytelling.
If you’re searching for a reliable face swap video online free solution before upgrading to premium features, Magic Hour provides one of the easiest starting points for experimenting with AI-powered video editing.
The platform also includes advanced lip sync ai generation, allowing spoken dialogue to match facial movements with impressive accuracy.
Image editing is another area where Magic Hour performs well. Its built-in ai image editor lets creators refine visuals before generating videos, reducing the need for external software.
For users who prefer prompt-driven editing, the ai image editor with prompt free workflow makes it easy to modify images using natural language instructions.
Developers will also appreciate that Magic Hour offers one of the best text to video API options currently available, making it suitable for SaaS products, creative automation, and enterprise workflows.
Pros
- Outstanding video quality
- Fast rendering speeds
- Excellent image-to-video generation
- Powerful face swap tools
- High-quality lip sync technology
- Beginner-friendly interface
- API available for developers
- Strong free plan
- Frequent feature updates
Cons
- Advanced generations consume credits quickly
- Highest-quality renders may take longer during peak demand
My Evaluation
After extensive testing, Magic Hour consistently produced the most polished outputs across marketing videos, product showcases, and creative storytelling. Instead of jumping between several AI tools, I could complete nearly every stage of production in one workspace. For creators, agencies, startups, and developers, it’s currently one of the easiest recommendations to make.
Pricing
- Free Plan: Yes
- Creator Plans: Paid monthly subscriptions
- Enterprise: Custom pricing
2. Runway
Runway remains one of the most recognizable names in AI-powered video creation, especially among filmmakers and creative professionals.
Its editing suite feels closer to traditional video software than many newer AI generators. Features like inpainting, background removal, motion brushes, and camera controls make it particularly attractive for experienced editors.
Pros
- Excellent cinematic quality
- Powerful editing workflow
- Advanced camera controls
- Frequent model improvements
- Strong collaboration features
Cons
- Learning curve for beginners
- Premium plans become expensive
- Some features require experimentation
My Evaluation
If your workflow already includes professional editing software, Runway integrates naturally into that process. It isn’t the simplest platform for newcomers, but experienced creators will appreciate the level of creative control it provides.
Pricing
- Free Plan: Yes
- Standard: Paid
- Pro: Paid
- Enterprise: Custom
3. Kling AI
Kling AI has quickly become one of the strongest competitors in realistic AI video generation.
During testing, it consistently generated natural human motion, convincing physics, and cinematic camera movement. Complex prompts generally produced impressive results without extensive tweaking.
The platform performs particularly well for storytelling, advertising concepts, and realistic visual scenes.
Pros
- Exceptional motion quality
- Realistic character animation
- High visual fidelity
- Strong prompt understanding
- Great cinematic output
Cons
- Longer rendering times
- Limited editing after generation
- Availability can vary by region
My Evaluation
If visual realism is your highest priority, Kling AI deserves serious consideration. While it lacks some of the integrated editing features available in Magic Hour, the overall video quality is among the best currently available.
Pricing
- Free Plan: Yes
- Premium Plans: Credit-based subscriptions
Coming in Part 2:
- Pika
- Luma Dream Machine
- Synthesia
- HeyGen
- InVideo AI
- Google Veo
- Adobe Firefly Video
- How I tested these tools
- Evaluation criteria
- AI video market trends in 2026
4. Pika
Pika has become a favorite among social media creators who need eye-catching videos without spending hours editing. Its interface is simple, the learning curve is minimal, and most projects can be completed in just a few minutes.
During testing, Pika performed especially well for short-form content on TikTok, Instagram Reels, and YouTube Shorts. The prompt interpretation is solid, and the animation styles are visually engaging.
Pros
- Easy for beginners
- Fast video generation
- Great for short-form content
- Creative animation presets
- Active product development
Cons
- Less control than professional tools
- Video consistency can vary on longer clips
- Limited advanced editing options
My Evaluation
If your primary goal is creating social content quickly, Pika is one of the easiest platforms to recommend. It removes much of the technical complexity while still producing attractive results.
Pricing
- Free Plan: Yes
- Pro Plans: Monthly subscription
5. Luma Dream Machine
Luma AI’s Dream Machine impressed me with its realistic motion and natural camera movement. It consistently generated videos that looked smooth and believable, especially for landscapes, architecture, and cinematic scenes.
The rendering quality is among the strongest available today, although generation times can occasionally be longer than competitors.
Pros
- Excellent realism
- Natural camera movement
- High-resolution outputs
- Great environmental animations
- Simple interface
Cons
- Fewer editing tools
- Limited customization after generation
- Heavy demand can slow rendering
My Evaluation
Luma Dream Machine excels when realism matters more than editing flexibility. If you’re creating product showcases, travel visuals, or cinematic B-roll, it’s an outstanding option.
Pricing
- Free Plan: Yes
- Paid Plans: Credit-based
6. Synthesia
Synthesia focuses on AI avatars rather than cinematic generation. Businesses use it to create training videos, onboarding materials, internal communications, and educational content.
Instead of generating entirely new scenes from prompts, Synthesia allows users to produce presenter-led videos with realistic digital avatars speaking multiple languages.
Pros
- Professional AI presenters
- Large language library
- Enterprise-ready
- Easy script-based workflow
- Excellent for corporate training
Cons
- Limited creative storytelling
- Less suitable for cinematic videos
- Premium features require higher-tier plans
My Evaluation
If your company regularly produces instructional videos, Synthesia can save significant production time and costs.
Pricing
- Free Trial
- Starter Plan
- Enterprise Pricing
7. HeyGen
HeyGen has established itself as one of the leading AI avatar platforms for marketers, educators, and businesses.
Its avatar quality has improved considerably over the past year, and multilingual voice support makes it attractive for international teams.
Pros
- High-quality avatars
- Excellent voice cloning
- Strong localization support
- Business-friendly templates
- API available
Cons
- Limited cinematic generation
- Avatar customization has some limits
- Advanced features require premium plans
My Evaluation
For businesses producing customer support videos, tutorials, and presentations, HeyGen remains one of the strongest choices available.
Pricing
- Free Trial
- Creator Plan
- Team Plan
- Enterprise
8. InVideo AI
InVideo AI targets marketers who need complete videos from a simple prompt.
Rather than generating short cinematic clips, it automatically builds an entire video—including script, visuals, voiceover, subtitles, transitions, and music.
During testing, this dramatically reduced production time for explainer videos and marketing content.
Pros
- Generates complete videos
- Excellent for marketing
- Built-in voiceovers
- Huge template library
- Fast workflow
Cons
- Less creative control
- Stock footage can feel repetitive
- AI scripts occasionally need editing
My Evaluation
If you’re producing blog videos, YouTube explainers, or promotional content every week, InVideo AI can significantly speed up your workflow.
Pricing
- Free Plan
- Plus
- Max
9. Google Veo
Google Veo represents the company’s latest advancement in generative video technology.
Although access is still limited compared with commercial competitors, the demonstrations show remarkable prompt understanding, realistic motion, and cinematic quality.
For enterprise users, Veo has the potential to become one of the industry’s most influential models.
Pros
- Outstanding visual quality
- Excellent prompt accuracy
- Realistic physics
- Advanced camera simulation
- Backed by Google’s AI ecosystem
Cons
- Limited availability
- Enterprise-focused
- Fewer public editing tools
My Evaluation
Veo isn’t yet the easiest option to access, but it’s clearly shaping the future of AI-generated video.
Pricing
- Limited Preview
- Enterprise Access
10. Adobe Firefly Video
Adobe continues integrating generative AI across Creative Cloud, and Firefly Video is a natural extension of that strategy.
It works especially well for designers already using Photoshop, Premiere Pro, and After Effects.
Pros
- Excellent Adobe integration
- Commercially friendly licensing
- Familiar interface
- Strong editing ecosystem
- High-quality outputs
Cons
- Best experience requires Adobe subscription
- Some AI features remain in beta
- Less flexible than dedicated AI-first platforms
My Evaluation
If your creative workflow already revolves around Adobe software, Firefly Video fits naturally into your existing production process.
Pricing
- Trial Available
- Creative Cloud Plans
How I Chose These AI Video Generators
I spent several weeks testing these platforms using identical prompts and real-world production scenarios rather than relying solely on marketing materials.
Each tool was evaluated across multiple categories:
- Video quality and realism
- Prompt understanding
- Rendering speed
- Ease of use
- Editing flexibility
- Image-to-video capabilities
- Avatar quality
- API availability
- Pricing and overall value
- Free plan limitations
I also compared how consistently each platform handled revisions, longer prompts, and different visual styles. While every tool on this list has strengths, none excelled in every category.
Magic Hour consistently delivered the strongest balance of creative quality, editing features, developer support, and ease of use, making it my overall top recommendation.
AI Video Generator Market Trends in 2026
The AI video landscape is evolving rapidly. Compared with just a year ago, today’s platforms generate longer, smoother, and far more realistic videos.
Several trends stood out during testing:
Multi-Tool Platforms Are Winning
Creators increasingly prefer platforms that combine video generation, image editing, face swapping, lip syncing, and animation instead of requiring separate applications.
APIs Are Becoming Essential
Developers are embedding AI video generation into SaaS products, marketing platforms, and workflow automation tools. Demand for production-ready APIs continues to grow.
Better Character Consistency
Maintaining consistent characters across multiple scenes was once a major challenge. Newer models have improved dramatically in preserving identity and appearance.
Faster Rendering
Rendering times continue to decrease as providers invest in more efficient infrastructure, allowing creators to iterate more quickly.
Higher Expectations from Businesses
Companies now expect AI video platforms to deliver commercial-quality outputs suitable for advertising, product launches, training, and customer education—not just experimental content.
As the market continues to mature, the gap between beginner-friendly tools and professional production platforms is narrowing, giving creators more flexibility than ever before.
Final Takeaway: Which AI Video Generator Should You Choose?
After testing these platforms across marketing campaigns, social media content, product demonstrations, educational videos, and creative storytelling, one conclusion stood out: there isn’t a single “perfect” AI video generator for everyone. The best choice depends on your workflow, budget, and creative goals.
That said, a few tools consistently rose to the top in their respective categories.
Best AI Video Generators by Use Case
| Use Case | Recommended Tool | Why It Stands Out |
| Best Overall | Magic Hour | Balanced feature set, excellent output quality, intuitive interface, and API support |
| Best for Professional Creators | Runway | Advanced editing tools and creative control |
| Best Cinematic Videos | Kling AI | Realistic motion and impressive prompt interpretation |
| Best Realistic Motion | Luma Dream Machine | Natural camera movement and visual fidelity |
| Best for Marketing Teams | InVideo AI | Quickly generates complete marketing videos |
| Best AI Avatars | Synthesia | Corporate training and multilingual presenter videos |
| Best Business Presentations | HeyGen | Professional avatars with excellent localization |
| Best Adobe Workflow | Adobe Firefly Video | Tight integration with Creative Cloud |
| Best Experimental AI | Google Veo | Cutting-edge generation quality with enterprise potential |
| Best for Short-Form Social Media | Pika | Fast, simple, and optimized for creators |
If you’re looking for one platform that balances quality, speed, ease of use, and creative flexibility, Magic Hour remains my top recommendation.
Its combination of text-to-video generation, image animation, face swapping, lip syncing, AI image editing, and developer-friendly API makes it suitable for everyone from solo creators to growing startups and enterprise teams.
The Future of AI Video Creation
AI video generation is moving beyond novelty and becoming a practical production tool.
We’re already seeing several major shifts:
- Longer and more coherent video generation
- Improved character consistency
- Faster rendering times
- Better audio synchronization
- Greater support for collaborative workflows
- More powerful APIs for developers
- Tighter integration with design and marketing platforms
Over the next year, I expect AI video generators to become a standard part of content creation pipelines rather than standalone experimental tools. Marketing teams, agencies, educators, and software companies are increasingly incorporating AI-generated video into their daily workflows.
The competition among providers is also accelerating innovation, which benefits creators through better quality, lower costs, and more specialized features.
How Often Should You Re-Evaluate Your AI Video Tool?
The AI landscape changes quickly. New models, pricing updates, and feature releases arrive almost every month.
As of July 2026, the rankings in this guide reflect the current state of the market, but it’s a good idea to revisit your preferred tool every few months. A platform that trails today could become the category leader after a major model update.
Refreshing your workflow quarterly can help you take advantage of new capabilities without getting locked into outdated processes.
Frequently Asked Questions
1. What is the best AI video generator in 2026?
Based on hands-on testing, Magic Hour is the best overall AI video generator in 2026. It offers an excellent balance of output quality, editing features, usability, API access, and pricing, making it suitable for creators, marketers, developers, and businesses.
2. Which AI video generator is best for beginners?
Pika and Magic Hour are excellent options for beginners. Both offer intuitive interfaces and require little technical knowledge while still producing high-quality results.
3. Which AI video generator has the best API?
For developers building AI-powered applications or automating video workflows, Magic Hour currently offers one of the strongest text-to-video API solutions available. Its documentation and integration options make it suitable for startups and enterprise applications alike.
4. Can I use AI video generators for commercial projects?
Yes. Most major AI video platforms allow commercial use under their paid plans, though licensing terms differ between providers. Always review the platform’s current commercial usage policy before publishing client or advertising work.
5. Are free AI video generators good enough?
Free plans are a great way to test features and workflows, but they usually come with limitations such as watermarks, reduced generation credits, lower resolution, or slower rendering. For regular content production, upgrading to a paid plan is often worthwhile.
Conclusion
AI video generation has reached a point where it can meaningfully reduce production time without sacrificing quality. Whether you’re producing marketing campaigns, educational materials, product demonstrations, or social media content, there’s a tool that fits your workflow.
For creators who want the most balanced experience, Magic Hour stands out thanks to its comprehensive feature set, polished outputs, and developer-friendly ecosystem. Professionals who need advanced editing may lean toward Runway, while those prioritizing cinematic realism should explore Kling AI or Luma Dream Machine.
The best approach is to take advantage of free plans or trials, recreate one of your real-world projects in a few different platforms, and compare the results. A short hands-on test will reveal which tool best matches your creative process and business needs.
As AI video technology continues to evolve, staying informed and experimenting with new features will help you produce higher-quality content more efficiently—and keep you ahead in an increasingly competitive digital landscape.
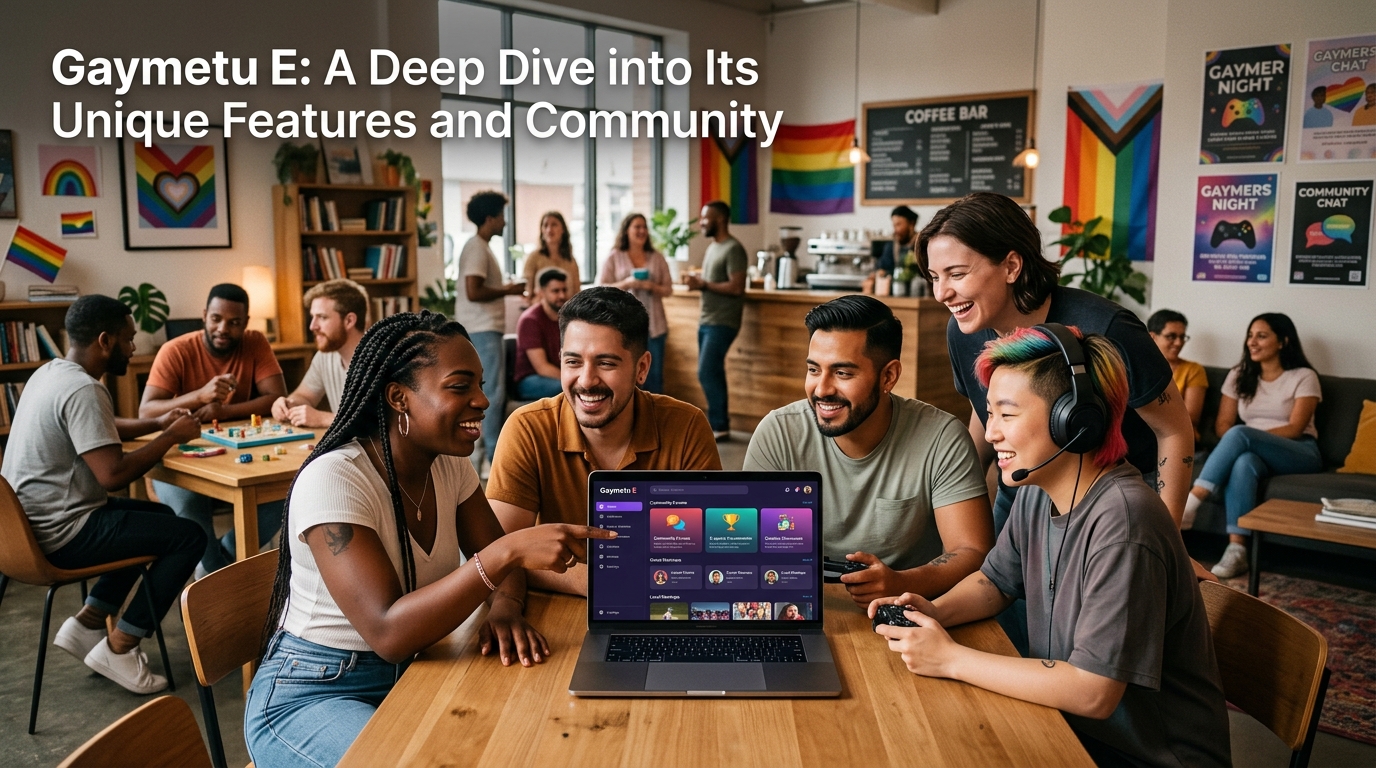
Welcome to the vibrant world of Gaymetu E, where creativity meets community in a platform designed specifically for LGBTQ+ gamers and enthusiasts. If you’ve ever dreamed of exploring virtual spaces that reflect your identity while connecting with like-minded individuals, this is the place for you. With its innovative features and inclusive atmosphere, Gaymetu E redefines what it means to socialize online. Buckle up as we take a deep dive into its unique offerings and discover why more people are flocking to this exciting gaming experience!
The History and Creation of Gaymetu E
Gaymetu E emerged from a vision to create an inclusive digital space for the LGBTQ+ community. Founded by passionate developers, the platform aimed to blend gaming with social interaction.
The concept took shape in 2020, during a time when online connectivity became crucial. With a focus on fostering friendships and connections, Gaymetu E was designed as more than just a game; it was meant to be a vibrant social hub.
Developers engaged with potential users throughout the creation process. Feedback shaped features that players desired most, such as customizable avatars and interactive environments. This collaboration fostered ownership among early adopters.
As word spread, interest soared, leading to rapid growth in its user base. Today’s Gaymetu E stands as a testament to what happens when creativity meets community-driven design in the ever-evolving world of online platforms.
Features of Gaymetu E:
Gaymetu E stands out for its customizable avatars. Players can express their individuality through a wide range of features, from hairstyles to outfits. This level of personalization fosters creativity and allows members to represent themselves authentically.
Social interactions are another cornerstone of Gaymetu E. Users can engage in various activities, whether it’s joining virtual parties or participating in group events. These social settings create vibrant communities where friendships flourish.
The platform also encourages collaboration through mini-games and challenges. Competing with friends adds an exciting layer to the experience while promoting teamwork and camaraderie.
With diverse chat options, users communicate freely and build connections seamlessly. The combination of customization and social engagement makes Gaymetu E a unique space for everyone looking to connect within the LGBTQ+ community.
– Customizable Avatars
One of the standout features of Gaymetu E is its customizable avatars. Users have an incredible range of options to express their identities. From skin tones and hairstyles to clothing styles, the possibilities are endless.
This level of personalization allows players to create a virtual representation that truly reflects who they are. It’s not just about aesthetics; it’s about authenticity in a digital space.
The avatar customization process is user-friendly and engaging. Players can mix and match different elements until they find the perfect combination that resonates with them.
Additionally, special items like accessories or themed outfits often roll out during events, providing even more opportunities for self-expression. This dynamic aspect keeps the community vibrant and encourages creativity among users as they share their unique creations with others.
– Social Interactions and Activities
Social interactions are at the heart of Gaymetu E. Players can engage with each other in a variety of ways, fostering a vibrant community spirit.
From casual chats to organized events, there’s always something happening. Users connect through voice and text chat options, making conversations fluid and engaging.
Group activities abound as well. Whether it’s participating in themed parties or collaborative challenges, members often find themselves working together to achieve common goals. This creates bonds that go beyond the game itself.
Additionally, special interest groups allow players to gather based on shared passions or identities. These micro-communities thrive within Gaymetu E’s expansive universe.
Interactive games and competitions enhance social dynamics even further. Friendly rivalries spark excitement while providing opportunities for connection and collaboration among users from diverse backgrounds.
The Growing Community of Gaymetu E
The community surrounding Gaymetu E is vibrant and ever-expanding. Players from diverse backgrounds come together, creating a rich tapestry of experiences and perspectives. This inclusivity fosters an environment where everyone feels welcome.
Regular events are hosted within the game, promoting interaction among users. These gatherings allow players to showcase their creativity while forging new friendships. From collaborative art projects to themed parties, there’s always something happening in this lively space.
Social media plays a crucial role in connecting members outside the game itself. Forums and groups dedicated to Gaymetu E thrive on platforms like Discord and Reddit. Here, participants discuss strategies, share stories, or simply chat about their daily lives.
Such engagement nurtures lasting relationships among players who bond over shared interests and hobbies. The sense of belonging that emerges is palpable; it transforms casual gameplay into meaningful connections that extend beyond the screen.
Benefits of Being a Part of the Gaymetu E Community
Being part of the Gaymetu E community opens doors to a world of connection and support. Members find a space where they can express themselves freely, sharing their experiences and stories without judgment.
The platform offers numerous opportunities for friendship. Users engage in activities that foster meaningful interactions, creating bonds that extend beyond the virtual realm.
In addition, participants benefit from an inclusive environment celebrating diversity. This sense of belonging can greatly enhance self-esteem and confidence.
Moreover, members often report feeling empowered through collaborations and creative projects within the community. The shared enthusiasm fuels motivation and creativity among users.
Being involved allows individuals to stay updated on LGBTQ+ issues while advocating for social change together. It’s more than just gaming; it’s about building connections that matter deeply in today’s world.
Potential Challenges and Controversies
While Gaymetu E has gained popularity, it’s not without its challenges. Some users express concerns about moderation within the community. Instances of hate speech or harassment can detract from the welcoming environment many seek.
Privacy is another significant issue. Users often share personal experiences and identities, making them vulnerable to unwanted attention or negative interactions.
The platform also faces scrutiny regarding inclusivity. While aimed at LGBTQ+ individuals, some feel that certain narratives overshadow others, leading to a lack of representation for diverse subgroups within the community.
Additionally, as with any online space, there are ongoing discussions about content regulation and safety protocols. Striking a balance between free expression and maintaining a safe atmosphere remains an ever-evolving challenge for Gaymetu E’s administrators and members alike.
Conclusion
Gaymetu E stands as a vibrant space where individuals can express themselves freely. Its unique features, from customizable avatars to engaging social interactions, create an inclusive atmosphere that fosters connection among users. The growing community is not just about gaming; it’s about building relationships and finding support.
For many, being part of the Gaymetu E community offers invaluable benefits such as acceptance and camaraderie. However, like any platform, there are challenges and controversies that arise which need addressing for continuous growth.
Embracing diversity in all its forms is at the heart of Gaymetu E’s mission. Whether you’re here for gaming or simply to connect with others who share similar experiences, this platform continues to evolve into a safe haven for many. Explore what Gaymetu E has to offer; you might find more than just a game—you may discover a home within its vibrant community.
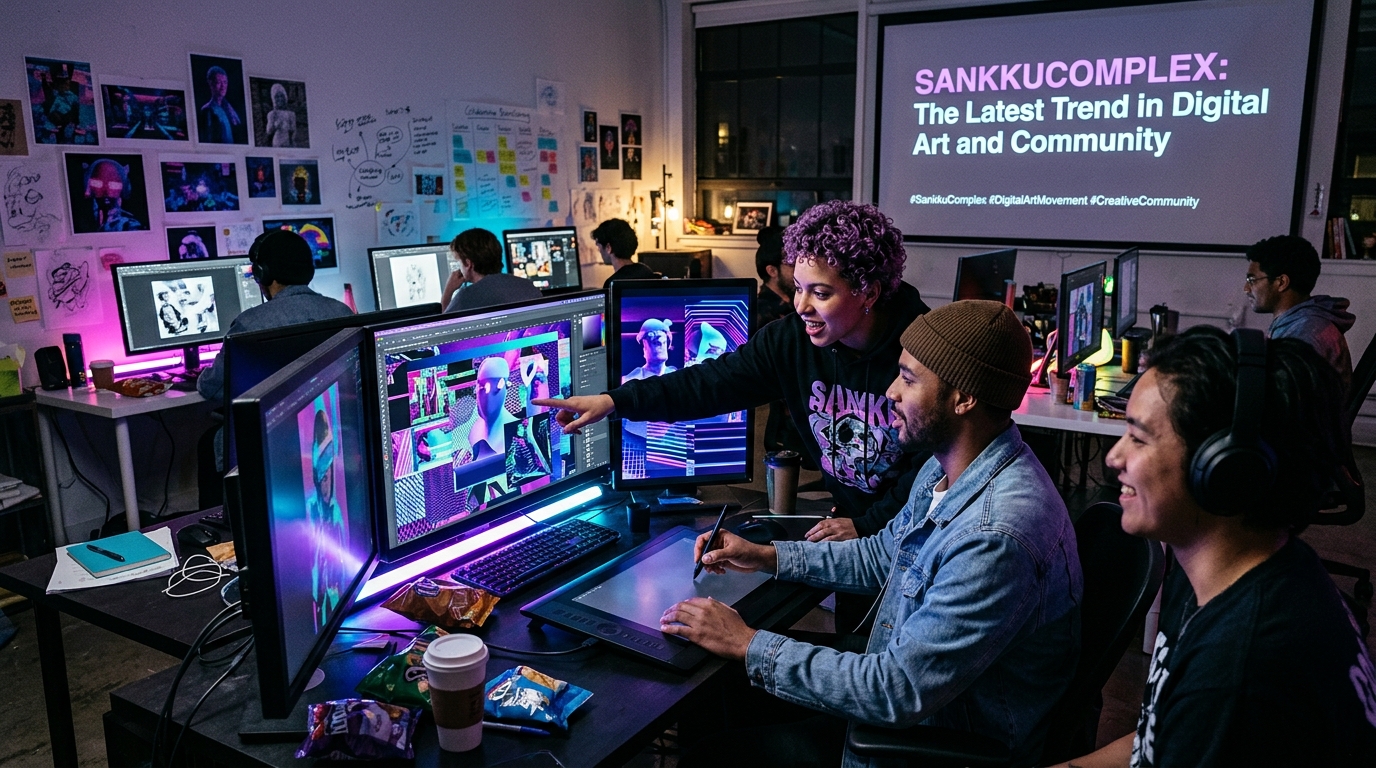
Digital art has taken the world by storm, transforming how we create and connect. Among the latest trends in this vibrant space is SankkuComplex, a platform that blends artistic expression with community building. Artists from various backgrounds are flocking to SankkuComplex, eager to explore its unique features and showcase their work. Whether you’re an established artist or just starting out, there’s something magical about this digital haven that invites creativity to flourish.
As we delve deeper into what makes SankkuComplex so special, prepare to uncover the rich history of digital art and learn how this platform is shaping its future. Join us on this journey through pixels and passion!
The History and Evolution of Digital Art
Digital art has transformed dramatically since its inception in the late 20th century. Initially, artists utilized rudimentary computer programs to create simple graphics. These early creations paved the way for more complex forms of expression.
As technology advanced, so did the tools available to artists. The introduction of software like Photoshop and Illustrator revolutionized how creators approached their work. Artists began exploring new styles and techniques that were previously unimaginable.
With the rise of the internet in the 1990s, digital art gained a wider audience. Online platforms provided a space for sharing artwork and connecting with fellow creatives globally. This fostered collaboration and inspiration among artists across different cultures.
In recent years, trends like NFTs (non-fungible tokens) have further expanded what digital art can be. Now, artists not only express themselves but also engage in innovative ways to monetize their work within vibrant online communities.
What Makes SankkuComplex Stand Out?
SankkuComplex is not just another digital art platform; it’s a vibrant ecosystem. Artists from various backgrounds come together to showcase their creativity, making it an inclusive space for all.
What truly sets SankkuComplex apart is its innovative approach to community engagement. The platform encourages interaction between artists and art lovers through regular events, workshops, and challenges. This creates a dynamic environment where inspiration flows freely.
Additionally, SankkuComplex offers unique tools that enhance the creative process. Whether it’s advanced editing features or collaboration options, each tool has been designed with the artist in mind.
Another standout aspect is the focus on storytelling within artworks. Each piece carries a narrative that resonates deeply with viewers. This emphasis on connection elevates digital pieces beyond mere visuals into something more meaningful.
By nurturing talent and promoting diverse voices, SankkuComplex redefines what it means to be part of a digital art community today.
How SankkuComplex Fosters a Community for Artists
SankkuComplex is more than just a platform for digital art; it’s a thriving community. Artists connect, collaborate, and share their work in an environment that encourages creativity.
Members utilize forums to discuss techniques and trends. These interactions spark inspiration and foster friendships among artists from diverse backgrounds.
The platform also hosts regular challenges and events that bring the community together. Participants can showcase their skills while receiving feedback from peers.
Moreover, SankkuComplex offers mentorship opportunities where seasoned artists guide newcomers. This nurturing approach helps build confidence and skill sets within the community.
Networking is another vital aspect of this ecosystem. Artists find opportunities not only to promote their work but also to partner with others on exciting projects. The sense of belonging here empowers individuals to grow both personally and professionally in the realm of digital art.
Tips for Beginners in the World of SankkuComplex
Diving into SankkuComplex can feel overwhelming at first. Start by exploring the platform’s diverse artwork and styles. This will give you a sense of what resonates with you.
Next, don’t hesitate to engage with fellow artists. Join discussions, ask questions, and share your thoughts. Building connections can inspire creativity and open doors to collaborations.
Practice is crucial in honing your skills. Experiment with different tools available on SankkuComplex to find what suits your artistic voice best.
Set small goals for yourself, whether it’s completing a piece each week or mastering a new technique monthly. Celebrate these milestones as they come.
Remember that feedback is invaluable. Share your work within the community and be open to constructive criticism; it’s an essential part of growth in this vibrant space!
Success Stories from SankkuComplex Artists
Artists on SankkuComplex have consistently pushed boundaries, showcasing their creativity in exciting ways. Many have transformed their passion into a full-time career.
Take Mia, for instance. She began sharing her digital illustrations and quickly gained traction within the community. Her unique style caught the eyes of several brands, leading to collaborations that elevated her visibility and income.
Then there’s Leo, whose 3D animations captured attention at an industry event. His work led to job offers from major studios eager to tap into his talent and fresh perspective.
These stories inspire countless others on the platform. They demonstrate that with dedication and support from fellow artists, anything is possible in the vibrant world of SankkuComplex.
The Future of SankkuComplex and Digital Art
The future of SankkuComplex is brimming with possibilities. As digital art continues to gain traction, platforms like this one are set to lead the charge in innovation.
Emerging technologies such as augmented reality and virtual reality will likely enhance user experiences within the community. Artists can create immersive works that engage audiences in ways previously unimaginable.
Furthermore, collaboration among creators may reach new heights. With a focus on interaction and shared growth, artists can build collective projects that push boundaries.
As more individuals recognize the value of digital art, SankkuComplex could become a hub for education and mentorship. Aspiring artists might find resources tailored specifically to their needs.
With these advancements on the horizon, SankkuComplex is poised not just to adapt but also to thrive in an ever-evolving landscape of creativity and technology. The excitement surrounding this platform reflects broader trends shaping the future of digital artistry itself.
Conclusion
SankkuComplex has emerged as a vibrant hub for digital art enthusiasts. It bridges the gap between creativity and community, allowing artists to showcase their talent while connecting with like-minded individuals. The platform’s unique features set it apart in an ever-evolving landscape of digital artistry.
As we look ahead, the potential for SankkuComplex is immense. It continues to attract new talent and foster innovation within its community. With each artist contributing their own narrative and style, the collective experience enriches everyone involved.
The future holds exciting possibilities for those who dare to explore this dynamic space. Whether you are an established artist or just starting your journey, being part of SankkuComplex means becoming part of something bigger—a movement that celebrates creativity in all its forms.
-

 HEALTH3 years ago
Transformative Health Solutions: Unveiling the Breakthroughs of 10x Health
-

 Posts3 years ago
Siegel, Cooper & Co.
-

 GENERAL3 years ago
Discovering the Artistic Brilliance of Derpixon: A Deep Dive into their Animation and Illustration
-

 Lifestyle3 years ago
Purenudism.com: Unveiling the Beauty of Naturist Lifestyle
-

 FASHION3 years ago
The Many Faces of “λιβαισ”: A Comprehensive Guide to its Symbolism in Different Cultures
-

 Lifestyle3 years ago
BaddieHub: Unleashing Confidence and Style in the Ultimate Gathering Spot for the Baddie Lifestyle
-

 Home improvement2 years ago
Unleash Your Creative Side: Exploring Stylish Rug Collections to Elevate Your Space with Quality Rug & Carpet Options
-

 PETS2 years ago
From Bows to Bandanas: Elevate Your Dog’s Style Game with These Trendy Accessories